Polling Graphite with Nagios
2012-05-31 20:37:00 by jdixon
I'm a big proponent of using Graphite as the source of truth for monitoring systems where polling host and service checks have traditionally been the norm. Realistically, this will take a long and gradual shift in philosophy by the larger IT community. Until then, we can still use Nagios and Graphite in tandem for powering more insightful checks of our application metrics.
There are actually a few different "check_graphte" scripts out there. The first one I saw announced publicly was Pierre-Yves Ritschard's check-graphite project. Shortly afterwards I published my own check_graphite script. Pierre's version is smaller but doesn't appear to automatically invert the thresholds (e.g. if critical is lower than warning). Otherwise you should be fine using either module; the remaining differences are mostly isolated to implementation details and default values. Since this is my blog, I'm going to use my script for this example. ;-)
- Comments (6)
A Foolishly Sensible Proposal for Graphite
2012-05-30 22:33:26 by jdixon
Let me get one thing out of the way, I fucking love Graphite. No other piece of software I've used has returned as much getting shit done value for so little personal investment. It's a triumph of function and utility, designed to help users collect metrics, store metrics, and extrapolate from those metrics with as little pain as humanly possible. The criticisms and suggestions I present below are conveyed with the utmost respect for all of Graphite's current and past developers, and in particular, Chris Davis and the original team at Orbitz who built and released it as open source. None of the rest of this post should detract from how rewarding it is to work with this tool.
- Comments (9)
Taxes are Orthogonal to Wages
2012-05-17 08:16:24 by jdixon
I've been reading about taxing the rich and high unemployment and how the middle class is dying for as long as I can remember. What no one seems to be talking about is that these problems are orthogonal, not causal. Raising the taxes on billionaires is not going to buoy the middle class' ability to buy a new car. And neither will lowering taxes on the rich have the adverse affect. We're no more likely to see a trickle down effect from the government raising taxes as we are from lowering them.
What we really should be asking is what can we do to motivate business owners to increase employee wages without regulation? I'm not sure there is a good answer for that. I think this is a systemic problem within our upper class, one tied to a sense of privilege and a lack of personal responsibility to community.
I don't have any answers. I just wanted to get these thoughts down and see what others think.
- Comments (3)
Organizing Your Graphite Metrics
2012-05-09 22:13:10 by jdixon
One of the most common questions I get from Graphite users is how best to name and/or organize metric paths. I don't have an exhaustive list of "best practices" but I'd like to share some basic insights I've accumulated.
Misaligned paths are ok. I used to be tempted to try and keep different paths aligned in order to ease correlation of related targets within a graph. Fortunately there are plenty of helpful aliasing functions (and wildcards) to help tame unruly paths.

- Comments (3)
The Story Behind Tasseo
2012-05-07 10:19:32 by jdixon
A little over a week ago I released the Tasseo dashboard. The response I got back was nothing short of astonishing. Tasseo is a Graphite dashboard, one of many to have been released in recent months. That fact alone led me to believe it would fly quietly under the radar. I couldn't have been more wrong; Tasseo (pronounced like Casio) tallied over 200 GitHub watchers in the first weekend, and should pass 300 today.
Tasseo was originally developed as a from-the-ground-up reimplementation of the Pulse dashboard we use at Heroku. Pulse has been a tremendously valuable tool for us; unfortunately, it has some drawbacks that make it a challenge to maintain.
- Comments (9)
A Precautionary Tale for Graphite Users
2012-05-02 22:09:36 by jdixon
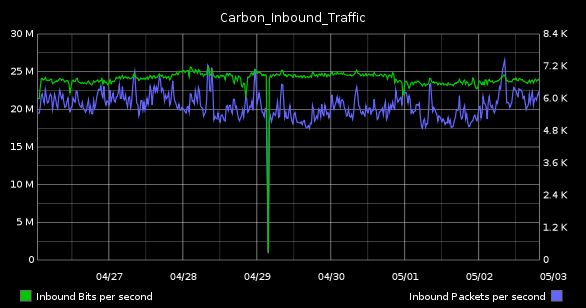
This morning I was collecting some graphs for one of our weekly status meetings. Asked to find something that represented the state of our Graphite system, I naturally gravitated to my usual standbys, "Carbon_Performance" (top) and "Carbon_Inbound_Bandwidth" (bottom).
| 1-day | 1-week |
|---|---|

|

|

|
|
The SysAdmin in me loves these because they highlight resource utilization on the server. While the former details disk I/O and CPU, the latter tracks inbound bandwidth in terms of bits and packets per-second. Although the network graph seems utterly boring (in as much as we've all used these in one form of another, from vendor-supplied dashboards to Cacti installations), it's this one that is actually the more complicated of the two to configure.
- Comments (6)
Unhelpful Graphite Tip #10 - Time Shifting
2012-04-25 08:44:44 by jdixon
Let's say you want to compare how a particular metric compares to some point in the past. This is a common practice in troubleshooting and capacity planning. What's the best way to achieve this in Graphite?
I might start off by selecting the past four weeks and visually discern the trends from week to week. Here's a graph showing the last month of AMQP activity. We can see that traffic was oscillating quite a bit over the first week and a half before smoothing out and gradually trending downward.

- Comments (10)
Unhelpful Graphite Tip #9 - xFilesFactor
2012-04-19 08:24:20 by jdixon
I love that Graphite can support per-second resolution. We've started to use it more frequently with applications that emit a constant stream of metrics to one of our aggregators. But there are times when an application might send updates less frequently, or when transient failures or network congestion result in lost metrics. In this case it makes sense to adjust your xFilesFactor value.
You may remember my last post that mentioned the whisper-info.py utility. It helps you extract metadata from your whisper files. Take for example, a whisper file for one of our collectd metrics:
$ sudo whisper-info.py /data/whisper/collectd/63694/swap/used.wsp

maxRetention: 31536000
xFilesFactor: 0.5
aggregationMethod: average
fileSize: 534580

Archive 0
retention: 86400
secondsPerPoint: 60
points: 1440
size: 17280
offset: 52

...
- Comments (9)
Unhelpful Graphite Tip #8 - Dump your Whisper Metrics
2012-04-18 10:59:38 by jdixon
If you've mucked around with your Whisper storage policies or needed to migrate your data to/from Graphite, there's a good chance you've used some of the bin scripts like whisper-info.py and whisper-fetch.py. Unfortunately there are some drawbacks with whisper-fetch.py, most notably that it only fetches content from the first archive to match the requested time period, and it won't return the original raw data after the rollup policies take effect.
- Comments (0)
Unhelpful Graphite Tip #7 - Organizing your Saved Graphs
2012-04-15 19:01:26 by jdixon
If you're logged into Graphite as an authenticated user you have the option of saving graphs, which will appear under the "My Graphs" folder in the navigation tree to the left. There are some limitations (you can't include spaces in the filename) but it's otherwise a useful feature for saving and sharing graphs with others.
Unknown to some users, Graphite's dot-delimited naming schema is not only available in metrics, but in saved graph names as well. Once you've created or modified a graph, click the Save button (floppy disk icon)...
- Comments (3)

 RSS 1.0