Benchmarking Graphite on NVMe
2016-09-13 13:56:30 by jdixon
Here's another quick update to demonstrate what's possible with a single Graphite node running master (these Carbon and Graphite-Web commits, specifically). As you'll see in the results below, this configuration was able to achieve 300k datapoints per second.
This test was performed on a Packet type 3 server with the pair of NVMe flash drives striped in a single LVM volume. Installation of the Graphite stack was still performed using Synthesize v.2.4.1. To take advantage of the increased I/O capacity I added more cache processes for a grand total of eight (8) relays and sixteen (16) caches. Five instances of Haggar ran concurrently, on a separate Packet type 1 server in the same Parsippany, NJ datacenter.
- Comments (2)
Benchmarking Graphite master on AWS
2016-09-12 12:15:25 by jdixon
Hello, friends. Just wanted to follow up the previous post with a quick update. As I've mentioned publicly, developing and cutting a new release from Graphite's master branch has become a personal and professional priority for me. And while I've become very familiar with much of the code base over the course of writing The Graphite Book and have thrown a lot of traffic at it over the last few months, I hadn't run any significant tests for performance regressions at scale (compared to the 0.9.15 release).
This round of tests used the same configuration and benchmarking processes as before. I neglected to mention this before, but all series of benchmarks started with installing Graphite using the Synthesize setup script. For the previous test I used Synthesize v.2.4.1 to install Graphite 0.9.15 on a 64-bit Ubuntu 14.04 LTS instance in Amazon's EC2 cloud. For this round I went with Synthesize v3.0.0RC2, which targets Graphite's master branch.
- Comments (0)
Benchmarking Carbon and Whisper 0.9.15 on AWS
2016-08-25 15:40:17 by jdixon
This is just a quick post to share some recent benchmarking results for a single Graphite 0.9.15 server. The host is a single EBS-optimized EC2 i2.4xlarge instance with a 400 GiB EBS Provisioned IOPS SSD (io1) with a requested 20k Max IOPS.
I'm not going to dive in too deep with the results, but I'll point out that with the following configuration we were able to increase batch writes effectively, resulting in a peak 38 points per update (pointsPerUpdate, averaged across all cache processes). This means that on average, caches were able to flush 38 datapoints from memory to disk with every write request.
- Comments (16)
Everybody Loves Graphite
2015-11-05 23:15:04 by jdixon
There was an article published recently - not here, and not to be linked or referenced here directly - proposing that "nobody loves Graphite" anymore. A linkbait title if I've ever heard one. Many folks linked this article to me, almost certainly expecting me to respond in an uproar. And yet, what I find myself really disappointed over is the obvious misrepresentation of fact (as it pertains to Graphite's technical limits) and an almost malicious disregard for the enormous community that uses it and contributes back to its ongoing development.
It's almost as if they're trying to sell you something. Nah, that couldn't be it.
I readily concede that Graphite was not designed for the transient nature of the sort of bleeding-edge containerized, clustering systems that are becoming popular in conference talks and Hacker News (if not in actual use in production, but we'll forgive them this tiny oversight). Admittedly, it takes an expertly skilled engineer to craft a background job for the purpose of removing old cruft. It's not every SysAdmin that knows how to cron, after all.
- Comments (5)
Graphite 0.9.14 - the Highlights
2015-11-01 11:11:12 by jdixon
As I mentioned in the previous blog post, we're perilously close to shipping the next Graphite release. Although we typically avoid large, sweeping changes in the stable branch, the long development cycle leading up to this particular release means we have a number of big new features and performance improvements to announce.
Rather than assume everyone will read and understand the significance of all the changes in the 0.9.14 Release Notes, I felt it would be a good idea to touch on some of them here. This collection represents a small handful of highlights among the numerous changes from this release. The sustained level of interest and contributions from the community continue to astound me. I can't thank everyone enough for their continued support of the Graphite project.
- Comments (0)
Graphite 0.9.14 - the Phoenix Release
2015-10-27 23:55:39 by jdixon
If you're like most Graphite users, you're probably wondering if and when there will ever be another release for the project. There hasn't been much public activity over the last couple of years, at least outside of GitHub. A lack of corporate sponsorship, in terms of dedicated developer and maintainer hours, means that the project receives attention as volunteers' schedules permit. Speaking solely for myself, I prioritize Graphite development somewhere behind family, work, the Monitorama conference, writing the Graphite book, and "other recreational activities".
Despite the lack of a regular release cycle, Graphite is as popular as ever. The Grafana project is going gangbusters, with Graphite as its priority time-series backend. A variety of new open source projects have cropped up offering high-performance alternatives to the original specification implementations (graphite-web and carbon). New software projects, both commercial and open source, continue to target Graphite API compatibility because of its ubiquity and ease of use. Heck, even those other competing time-series engines are forced to support Graphite-friendly interfaces. In some cases they even outperform their own proprietary ingress methods.
- Comments (0)
On Writing the Graphite Book
2015-02-22 23:56:56 by jdixon
I'm writing a book. This may come as a surprise given the lack of content on this blog over the last... entire year of 2014. Nevertheless, I'm pleased to report that the rumors are true and I am in fact writing a book about Graphite.
Three different editors at O'Reilly contacted me over the course of a few years about the possibility of authoring a volume about my favorite Open Source time-series rendering engine. I had significant concerns about the availability of free time I'd have to spend on this project, so I had to turn them down the first couple times. Last year, something finally clicked and I relented. And so, Monitoring with Graphite became a thing.

We've decided to release it as a work in progress, with the Early Release going on sale in December 2014 and an expected official release around June 2015. According to the outline we're almost at the halfway point of the book, so I think it's reasonable to say we're still on schedule.
If you've enjoyed my blog posts, I really think you'll love the book. I've included a healthy discussion around monitoring concepts and the "composable monitoring system", a deep dive into the Graphite components, fully fleshed-out installation processes and tips of the trade, and a helluva lot more. I aim to be as comprehensive as possible while still managing to keep it an entertaining read. Frankly, this is probably the only subject matter that I'll know well enough to write a book about, so I'm not about to let myself screw it up.
I encourage you to grab the Early Release Ebook and provide feedback. Your comments and suggestions (or questions) will continue to fuel the content for the rest of the book. And if you make it out to Monitorama this summer, I'll be happy to sign your tablet or laptop.
- Comments (2)
Graphite Tip - A Better Way to Store Events
2014-01-05 20:54:03 by jdixon
Graphite is well known for storing simple key/value metrics using the Whisper time-series database on-disk format. What is not well known about Graphite is that it also ships with a feature known as Events that supports a richer form of metrics storage suitable for, well, events. Imagine a place where you could store tagged metrics and additional data relevant to the event (e.g. code snippets, comments, etc). Many folks use NoSQL databases such as HBase for this purpose, and that's a perfectly reasonable approach. However, if you'd like to store these somewhere where they can be correlated with the rest of your Graphite metrics, then Events might be a good fit for you.
- Comments (11)
Graphite Tip - Django 1.4 Admin Workaround
2014-01-05 00:39:38 by jdixon
If you're using Graphite with Django 1.4 or newer, you've probably noticed the broken styling on the Admin module. This appears to be an annoyance at worst, but it's ugly nonetheless. I don't have a fix for this yet, but I have a workaround for anyone using Apache with their Graphite web UI.
- Comments (5)
Graphite Tip - Working with Carbonate
2014-01-02 20:29:59 by jdixon
One of my friends at GitHub, Scott Sanders, recently published a new suite of tools collectively known as Carbonate. Anyone who has had the "pleasure" of migrating Graphite to one or more new servers, in production, has likely felt the pain of dealing with gaps in your time-series data. This is a common source of pain for many administrators; I'm really pleased that Scott was able to put together this collection of shell primitives for managing Whisper migrations.
- Comments (4)
Migrating Graphite from SQLite to PostgreSQL
2013-12-14 19:29:20 by jdixon
As mentioned in my previous article, I no longer recommend using SQLite as a Graphite backend for anything outside of development or testing work. It is too lenient with data types, and doesn't provide the levels of concurrency I'd like to see in an RDBMS for a production web service.
This opinion was cultivated almost exclusively from my recent experience migrating a single-node Graphite instance with an SQLite database to an HA pair of Graphite nodes with a shared PostgreSQL backend. For those of you considering migrating off SQLite to PostgreSQL, this article documents my initial struggles and eventual fixes for this transition.
- Comments (4)
Why You Shouldn't use SQLite with Graphite
2013-12-10 19:44:07 by jdixon
If you've ever had the pleasure of installing Graphite, you're almost certainly aware that it uses Django as it's web framework. In order to support features like saving graphs and dashboards, Graphite needs somewhere to store the data that describes these objects. As you might expect, a relational database with support for SQL is a dandy place for this sort of relational data. Django supports a number of RDBMS backends using the Django ORM, making it relatively painless to get started with Graphite in a development or test environment using the popular SQLite database engine.
- Comments (0)
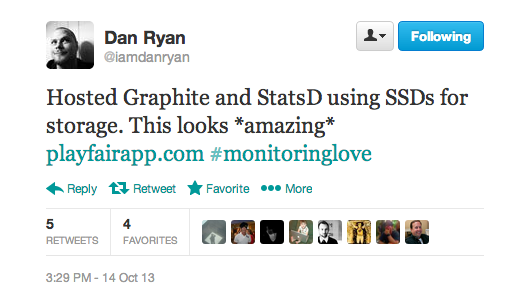
What's Up with Playfair?
2013-10-19 02:58:37 by jdixon
Within the last hour I stumbled across a tweet from Dan Ryan mentioning a new hosted Graphite + StatsD service called Playfair. As you might expect, this piqued my interest.
Immediately, I thought of Hosted Graphite and wondered how this compares with their offering. Would it have its own dashboard? Was it a DigitalOcean-backed Graphite instance (admittedly, something I've considered trying to package up myself)? I hopped over to their website and looked around.
- Comments (1)
Graphite Tip - Mixing Lines and Stacks
2013-08-16 13:43:15 by jdixon
One of Graphite's shortcomings is that it's not easy to construct a composite chart of both lines and area sections. In fact, it's not possible at all unless you're willing to stack your areas. But if you are dealing with data where it makes sense to stack them, and you want to correlate that with something else as a line series, here's an example demonstrating how you can do it.
- Comments (1)
Dusk - Yet Another Graphite Dashboard
2013-06-21 19:36:28 by jdixon
Not too long ago we were looking for a way to visualize a group of metrics across our entire fleet. Although you could render all of the metrics on one graph, it becomes nearly impossible to distinguish one from another. Jesse Newland (@jnewland) suggested that we look at Cubism.js' horizon charts. The nice thing about horizon charts is that you can cram a lot of information into a small vertical space, due to the way they render "overlapping" values with increasing intensity. One thing led to another, and soon Dusk was born.
- Comments (6)
Graphite Tip - Counting Number of Metrics Reported
2013-05-27 13:59:50 by jdixon
There's been many a time when I've asked the question "I wonder how many hosts are sending this metric?" Unfortunately there's no built-in Graphite function for determining the number of hosts submitting a particular metric (or tree of metrics). But this morning I stumbled across a brilliant hack of a Graphite query by Jesse Newland (@jnewland) for rendering this value.
- Comments (7)
WTF is Chartroulette
2013-05-13 16:32:42 by jdixon
Sometimes the silliest features are the ones that inspire you most. This was certainly the case with the new Chartroulette view that I recently merged into Descartes. Because I wanted so badly for this to become a reality it forced me to knock out some other dependencies (user model, favorite dashboards, and better user mapping) rather quickly.
To be fair, there's nothing silly about the idea behind Chartroulette. At GitHub we have an internal app by @maddox that allows users to rotate any Mac or iOS-based device's screen through a series of website URLs. Typically we use this to cycle through dashboards or graphs. While I'd love to see this open-sourced, I know that Jon is a very busy guy so I figured that emulating this functionality within Descartes might be the next best thing.
- Comments (0)
Feeding Params into Descartes
2013-05-06 13:07:32 by jdixon
This is a relatively minor enhancement in terms of LoC but it would take too many words to describe on Twitter so here we are. Recent commits added support for passing interval and columns parameters into Descartes views (graphs, dashboards, etc). Previously you would always get the default layout whenever loading any Descartes page.
- Comments (0)
Graphite Tip - Group by Node
2013-04-14 18:23:29 by jdixon
In the process of setting up some graphs for Status Board, I thought it would be nice to render my GitHub activity (in terms of commits). As I demonstrated in a post last year, you can fire off a metric to Graphite using GitHub's post-commit webhook feature. Rendered with drawAsInfinite, this is nice for getting a rough visualization of your commit activity, but doesn't provide total counts. Alternatively, you could use group with summarize to get totals per interval, but you wouldn't be able to view per-repository numbers.
- Comments (0)
Graphite Tip - Grouping Release Metrics in the Legend
2013-04-03 12:48:07 by jdixon
Last year I gave examples for using drawAsInfinite to help visualize the frequency of particular events (deploys, commits, etc). One of the side effects that I failed to mention is that these will quickly fill up your legend with labels, making it impossible to view the legend at all. It's likely that you've seen this sort of thing at least once (assuming you forced hideLegend=false):

- Comments (0)
Graphite Tip - Converting Zeroes into Nulls
2013-04-01 17:43:26 by jdixon
I was looking at some internal data for @jnunemaker and @jfryman today when I stumbled across the Data Filters group of functions inside the Graphite composer. These functions are handy for those times when you want to exclude a subset of a particular series of data, for whatever reason. In our case, we were looking at some metrics where we had spikes of data that were interesting, and a lot of uninteresting data reported as zeroes.
- Comments (0)
Adding a Metrics Cache to Descartes
2012-11-08 00:00:26 by jdixon
Update / TL;DR: Thanks to Bernd Ahlers (@berndahlers) for clueing me into the fact that you can call rufus-scheduler directly rather than indirectly through resque-scheduler. Because it uses Event-Machine, there's no need to run separate worker processes or queue up the jobs. Consider me sold. The changes have already been committed.
If you still want to read the original post, continue on.
Today I merged in a refactor of the Descartes bits that deal with metrics. Specifically, the live Metrics tab and sparklines view. This will have a profound effect on performance, but can also have a surprising effect on your wallet if you're not paying attention.
So, a little background on how Descartes used to operate and why this change was necessary. Not too long ago I added a new Metrics page that displays sparklines for every metric in your Graphite server and lets you click on them to create a composite graph. Although the page is still rather immature, it's useful for basic visualization and graph creation. Personally I think its major selling point right now is in the sparklines I mentioned. This is one thing that you don't really get with native Graphite -- being able to quickly see activity patterns on any metrics without going through the hassle of actually creating a graph. This is made that much more awesome by the presence of live filtering. Click on the Add to Graph button and you're presented with an additional input field that, as you type a string, will filter down the list of metric sparklines you're viewing in realtime.
- Comments (4)
Assembling Uptime, Umpire and Graphite
2012-10-16 11:05:08 by jdixon
Just this morning I discovered the Uptime project over on GitHub. The author bills it as "A simple HTTP remote monitoring utility using Node.js and MongoDB". I'm already in love with this tool thanks to its composability and ease of use.
The documentation over at the Uptime project is quite good, so I won't bore you with the details. The basic gist is that you'll want to have a MongoDB server available (OS X users can just brew install mongodb) and Node.js (at least version 0.8). Clone the repo locally and then run node app.js to start the monitor (web UI) and analyzer (check engine).
- Comments (0)
Screencast - Installing Graphite from Source
2012-08-28 12:51:54 by jdixon
A couple weeks ago I uploaded a new screencast and tweeted about it, but I completely forgot to mention it here. This is a fairly thorough demonstration for installing Graphite from git checkouts on an Ubuntu 10.04 server. Please let me know if you have any questions about the content or ideas for future screencasts.
I would recommend watching it in fullscreen in at least 720p resolution. All commands and configurations referenced in the video can be found here.
- Comments (2)
Trending your PagerDuty Alerts in Graphite
2012-08-28 12:04:09 by jdixon
We've noticed an increase in alerts recently at $DAYJOB. So naturally we thought it would be helpful to begin tracking Nagios alerts in Graphite. Alas, this will only help us going forward, so I wondered how difficult it would be to retrieve historic data from PagerDuty and import it into Graphite. Turns out it isn't too hard, although we have to work around some of the limitations in PagerDuty's Incidents API.
- Comments (0)
My Personal Roadmap
2012-08-26 18:21:47 by jdixon
I've been a little busy lately and haven't found the time to post any new articles, Graphite-related or otherwise. For those who missed the announcement, I started working at GitHub in July. Initially I continued my work on Descartes; more recently my time has been split up among a few different projects, both inside and outside of work. Although I generally detest announcing plans before shipping them, I thought others might like to read about what I'm working on these days.
- Comments (0)
Trending your GitHub Commits in Graphite
2012-07-22 22:45:55 by jdixon
Today I was browsing the list of service hooks that GitHub provides. I almost forgot that there's a simple WebHook service that POSTs commit information during the git post-receive hook to any external URL. This got me thinking that it would be nice to trend commit activity inside my Graphite server. Don't get me wrong... GitHub already provides some really nice visualization for project and committer activity on their site. However, as a data junkie, I'd love to be able to correlate this activity with my own application metrics.
This was a perfect fit for Backstop, the HTTP/JSON-to-Graphite bridge. After a couple hours of futzing around I had a working version. If you haven't used Backstop before, rest assured that getting started is pretty darn easy. In fact, if you're a Heroku customer, it's easy and free. There are just a few commands to get your own Backstop server running on Heroku.
- Comments (0)
Introducing Descartes
2012-07-10 17:51:45 by jdixon
Graphite is renowned for its usefulness and ease for prototyping new charts. It's also known for having a dashboard component that leaves much to be desired. In response the community has seen a rising tide of new dashboard projects aimed at filling this gap. The growing list of third-party Graphite dashboard projects is extensive, but continues to fall short in areas such as self-service, configuration, and collaboration.
Most of this software require users to generate dashboards from JSON or other command-line gymnastics. While this is reasonable for many operations folk, it's an impedance for the engineers and business-oriented users; the same users that we want using this software for making sound decisions. Graph views are static and inflexible for collaboration and historical dialogues. In response to these shortcomings I've started the Descartes project.
- Comments (3)
El Cheapo Network Graph
2012-07-08 12:45:58 by jdixon
Here's an embarrassingly simple script I threw together this morning to track network latency to a handful of remote websites/networks from my home internet. Yes, I understand that these numbers are highly influenced by my proximity to various CDN networks and bear no resemblance to how actual web browsing would perform concurrently. That isn't the point. This is merely to demonstrate a cheap and easy way to get more metrics into Graphite; and at the same time, providing me with some useful reference for when my home internet provider will inevitably have hiccups.
- Comments (1)
Velocity 2012 Postmortem
2012-06-29 16:23:23 by jdixon
This week I traveled out west for my first Velocity conference as an attendee. I went out two years ago but I was so busy juggling exhibitor duties that I didn't get to enjoy any hallway networking or formal session. This year I went in with plans to catch as many sessions as possible, particularly those skewed towards monitoring, trending and operations workflow. As expected, I skipped quite a few talks but made up for it with a lot of quality time catching up with peers and reviewing new technologies (and philosophies) in the DevOps space.
- Comments (2)
Watching the Carbon Feed
2012-06-01 11:40:25 by jdixon
This is one of my most favorite, and certainly most underappreciated graphs. Its simplicity belies its usefulness. This single chart gives me a holistic view of our metrics feed, writes to Whisper files, as well as general system health. At a glance I can correlate slow updates caused by a spike in Whisper file creations or a backup resulting in a higher PPU value. We use some of its targets with Nagios to monitor for metric feed issues. And it's always the first place I look whenever there's a whiff of Graphite problems.
- Comments (5)
Polling Graphite with Nagios
2012-05-31 20:37:00 by jdixon
I'm a big proponent of using Graphite as the source of truth for monitoring systems where polling host and service checks have traditionally been the norm. Realistically, this will take a long and gradual shift in philosophy by the larger IT community. Until then, we can still use Nagios and Graphite in tandem for powering more insightful checks of our application metrics.
There are actually a few different "check_graphte" scripts out there. The first one I saw announced publicly was Pierre-Yves Ritschard's check-graphite project. Shortly afterwards I published my own check_graphite script. Pierre's version is smaller but doesn't appear to automatically invert the thresholds (e.g. if critical is lower than warning). Otherwise you should be fine using either module; the remaining differences are mostly isolated to implementation details and default values. Since this is my blog, I'm going to use my script for this example. ;-)
- Comments (6)
A Foolishly Sensible Proposal for Graphite
2012-05-30 22:33:26 by jdixon
Let me get one thing out of the way, I fucking love Graphite. No other piece of software I've used has returned as much getting shit done value for so little personal investment. It's a triumph of function and utility, designed to help users collect metrics, store metrics, and extrapolate from those metrics with as little pain as humanly possible. The criticisms and suggestions I present below are conveyed with the utmost respect for all of Graphite's current and past developers, and in particular, Chris Davis and the original team at Orbitz who built and released it as open source. None of the rest of this post should detract from how rewarding it is to work with this tool.
- Comments (9)
Organizing Your Graphite Metrics
2012-05-09 22:13:10 by jdixon
One of the most common questions I get from Graphite users is how best to name and/or organize metric paths. I don't have an exhaustive list of "best practices" but I'd like to share some basic insights I've accumulated.
Misaligned paths are ok. I used to be tempted to try and keep different paths aligned in order to ease correlation of related targets within a graph. Fortunately there are plenty of helpful aliasing functions (and wildcards) to help tame unruly paths.

- Comments (3)
The Story Behind Tasseo
2012-05-07 10:19:32 by jdixon
A little over a week ago I released the Tasseo dashboard. The response I got back was nothing short of astonishing. Tasseo is a Graphite dashboard, one of many to have been released in recent months. That fact alone led me to believe it would fly quietly under the radar. I couldn't have been more wrong; Tasseo (pronounced like Casio) tallied over 200 GitHub watchers in the first weekend, and should pass 300 today.
Tasseo was originally developed as a from-the-ground-up reimplementation of the Pulse dashboard we use at Heroku. Pulse has been a tremendously valuable tool for us; unfortunately, it has some drawbacks that make it a challenge to maintain.
- Comments (9)
A Precautionary Tale for Graphite Users
2012-05-02 22:09:36 by jdixon
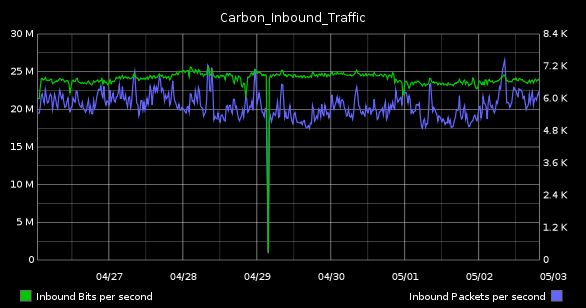
This morning I was collecting some graphs for one of our weekly status meetings. Asked to find something that represented the state of our Graphite system, I naturally gravitated to my usual standbys, "Carbon_Performance" (top) and "Carbon_Inbound_Bandwidth" (bottom).
| 1-day | 1-week |
|---|---|

|

|

|
|
The SysAdmin in me loves these because they highlight resource utilization on the server. While the former details disk I/O and CPU, the latter tracks inbound bandwidth in terms of bits and packets per-second. Although the network graph seems utterly boring (in as much as we've all used these in one form of another, from vendor-supplied dashboards to Cacti installations), it's this one that is actually the more complicated of the two to configure.
- Comments (6)
Unhelpful Graphite Tip #10 - Time Shifting
2012-04-25 08:44:44 by jdixon
Let's say you want to compare how a particular metric compares to some point in the past. This is a common practice in troubleshooting and capacity planning. What's the best way to achieve this in Graphite?
I might start off by selecting the past four weeks and visually discern the trends from week to week. Here's a graph showing the last month of AMQP activity. We can see that traffic was oscillating quite a bit over the first week and a half before smoothing out and gradually trending downward.

- Comments (10)
Unhelpful Graphite Tip #9 - xFilesFactor
2012-04-19 08:24:20 by jdixon
I love that Graphite can support per-second resolution. We've started to use it more frequently with applications that emit a constant stream of metrics to one of our aggregators. But there are times when an application might send updates less frequently, or when transient failures or network congestion result in lost metrics. In this case it makes sense to adjust your xFilesFactor value.
You may remember my last post that mentioned the whisper-info.py utility. It helps you extract metadata from your whisper files. Take for example, a whisper file for one of our collectd metrics:
$ sudo whisper-info.py /data/whisper/collectd/63694/swap/used.wsp

maxRetention: 31536000
xFilesFactor: 0.5
aggregationMethod: average
fileSize: 534580

Archive 0
retention: 86400
secondsPerPoint: 60
points: 1440
size: 17280
offset: 52

...
- Comments (9)
Unhelpful Graphite Tip #8 - Dump your Whisper Metrics
2012-04-18 10:59:38 by jdixon
If you've mucked around with your Whisper storage policies or needed to migrate your data to/from Graphite, there's a good chance you've used some of the bin scripts like whisper-info.py and whisper-fetch.py. Unfortunately there are some drawbacks with whisper-fetch.py, most notably that it only fetches content from the first archive to match the requested time period, and it won't return the original raw data after the rollup policies take effect.
- Comments (0)
Unhelpful Graphite Tip #7 - Organizing your Saved Graphs
2012-04-15 19:01:26 by jdixon
If you're logged into Graphite as an authenticated user you have the option of saving graphs, which will appear under the "My Graphs" folder in the navigation tree to the left. There are some limitations (you can't include spaces in the filename) but it's otherwise a useful feature for saving and sharing graphs with others.
Unknown to some users, Graphite's dot-delimited naming schema is not only available in metrics, but in saved graph names as well. Once you've created or modified a graph, click the Save button (floppy disk icon)...
- Comments (3)
Graphite Script for Campfire Hubot
2012-04-13 23:42:57 by jdixon
We use Campfire extensively at $DAYJOB. As our Ops team is 100% remote, it's become indispensable for us. Although it has some minor warts (lack of proper timestamps) it works quite well as a chat medium and collaboration tool. Because of its popularity, there are tons of plugins available. Not the least of which is Hubot, a bot written by GitHub specifically for Campfire.
- Comments (0)
Unhelpful Graphite Tip #6 - Filtering by Most Deviant
2012-04-13 09:57:32 by jdixon
I remember one day when I was trying to narrow down an application causing high load on an outlier within a fleet of servers. Nagios wasn't suitable for the task, as it only told me which hosts were currently spiking, not which ones have been spiking for a certain window of time. And it certainly couldn't identify a particular host based on a performance visualization.
My Graphite wizard hat went on and I went to work, narrowing down the list of suspects using wildcards and visually inspecting each host's load profile. Within 5 minutes I found my suspect and basked in my glory.
Naturally my brilliance was short-lived.
- Comments (1)
Unhelpful Graphite Tip #5 - Solid State Drives
2012-04-12 15:32:40 by jdixon
Artur Bergman (@crucially) kindly recommends:

Editor's Note: Seriously though, you really should move your Whisper files over to SSD if you haven't already. The IO gain is tremendous and allows you to spend your time being more creative with process distribution across CPU cores (hint: future article).
- Comments (3)
Unhelpful Graphite Tip #4 - Bootstrap the Django DB
2012-04-12 08:17:43 by jdixon
If you're not already aware, Graphite uses Django as the web framework for its underpinnings. In particular, it relies on Django for all user administration, authentication and authorization facilities. This is convenient for Graphite developers, but can be rather inconvenient for Graphite administrators with little-to-no Django experience.
One of my earliest headaches with automating Graphite installations was trying to workaround the interactive manage.py syncdb step from the installation doc. This is usually something everyone wants to run, since it performs the initial admin user creation.
- Comments (6)
Unhelpful Graphite Tip #3 - JSON Output
2012-04-11 10:06:13 by jdixon
I love JSON. No really, I fucking love JSON. It might have something to do with its phonetic approximation to my own name. Or it might be my preference for anything that hastens the death of XML. Either way, it's a handy format that's become ubiquitous for data interchange. And fortunately for those of us who prefer our graphs rendered client-side, Graphite supports it as an output format.
- Comments (4)
Unhelpful Graphite Tip #2 - Graph Bookmarklet
2012-04-10 18:58:26 by jdixon
I wish I could say I've been using this little gem for years. Alas, I just learned about it last night courtesy of R. Tyler Croy (@agentdero). This has already been a godsend, in less than one full day of use.
- Comments (3)
Unhelpful Graphite Tip #1 - Frequency of Events
2012-04-10 00:41:02 by jdixon
I'd like to begin sharing more of my knowledge as it pertains to using Graphite in production. Most of these upcoming posts are bound to be of the "check out this cool function" variety, but hopefully you can stitch them together into something useful. Before I proceed, I'd like to thank Chris Davis and the team at Orbitz who started this incredible software project and released it to the open-source community. Without your work I'd be stuck using something... less awesome.
Today's tip comes courtesy of a combined effort by me and Michael Leinartas (@mleinart). I've used this particular combination of functions before to calculate the number of "events" in a series during a particular timeframe. Unfortunately I failed to record this query anywhere (pro-tip: save your best Graphite functions in a document or gist, you'll be glad you did) although I had a vague idea of the functions needed. Michael was kind enough to remind me of the particular order for chaining the functions.
- Comments (6)
Trending with Purpose
2011-03-18 13:52:44 by jdixon
I threw together a presentation on short notice this week for an internal tele-conference about Trending with Purpose. The end result was much better than I might have expected (even given my penchant for procrastinating). Although much of the content is specific to applications currently in use at $DAYJOB, I think there's something to take out of it even if you're not using these tools.
The content is intended for developers who might not (or know how to) use application profiling data to complement their operations' monitoring and trending efforts. Special props to the Orbitz.com developers for open-sourcing their Graphite graphing tool, as well as John Allspaw and the Etsy Engineering team for their work on StatsD, and for generally serving as innovators in the Web Operations industry.
Special note: These slides were thrown together in rapid fashion. Anyone who experiences violent reactions to Gill Sans Italic should not download this slideshow. You have been warned.
The slides are available here.
- Comments (3)

 RSS 1.0