Adding a Metrics Cache to Descartes
2012-11-08 00:00:26 by jdixon
Update / TL;DR: Thanks to Bernd Ahlers (@berndahlers) for clueing me into the fact that you can call rufus-scheduler directly rather than indirectly through resque-scheduler. Because it uses Event-Machine, there's no need to run separate worker processes or queue up the jobs. Consider me sold. The changes have already been committed.
If you still want to read the original post, continue on.
Today I merged in a refactor of the Descartes bits that deal with metrics. Specifically, the live Metrics tab and sparklines view. This will have a profound effect on performance, but can also have a surprising effect on your wallet if you're not paying attention.
So, a little background on how Descartes used to operate and why this change was necessary. Not too long ago I added a new Metrics page that displays sparklines for every metric in your Graphite server and lets you click on them to create a composite graph. Although the page is still rather immature, it's useful for basic visualization and graph creation. Personally I think its major selling point right now is in the sparklines I mentioned. This is one thing that you don't really get with native Graphite -- being able to quickly see activity patterns on any metrics without going through the hassle of actually creating a graph. This is made that much more awesome by the presence of live filtering. Click on the Add to Graph button and you're presented with an additional input field that, as you type a string, will filter down the list of metric sparklines you're viewing in realtime.
- Comments (4)
A Simple HTTP POST Server in Node.js
2012-10-16 21:48:16 by jdixon
In the process of hacking on a plugin for the Uptime project I realized that I needed a simple HTTP server capable of receiving and dumping JSON data via POST. I'm well aware of the awesome Python SimpleHTTPServer module, but alas it doesn't support POST requests.
Fortunately I was able to throw together a quick little server using the sample HTTP server on the Node.js project website along with their API docs. I know this is a ridiculously simple daemon, but someone else might find it as useful as I did.
- Comments (0)
Assembling Uptime, Umpire and Graphite
2012-10-16 11:05:08 by jdixon
Just this morning I discovered the Uptime project over on GitHub. The author bills it as "A simple HTTP remote monitoring utility using Node.js and MongoDB". I'm already in love with this tool thanks to its composability and ease of use.
The documentation over at the Uptime project is quite good, so I won't bore you with the details. The basic gist is that you'll want to have a MongoDB server available (OS X users can just brew install mongodb) and Node.js (at least version 0.8). Clone the repo locally and then run node app.js to start the monitor (web UI) and analyzer (check engine).
- Comments (0)
A Candid Word about Monitorama
2012-10-12 10:22:31 by jdixon
Registration for Monitorama opens up one week from today. We're in the highly unusual situation of being a first-year conference that will very likely sell out in almost as short a time as it took to plan it. However, while I'm thrilled that so many incredible people want to attend, I want to take a moment to make sure everyone fully understands what this event is truly about, and what I personally expect to come out of it.
Monitorama will be an inclusive conference. There will be no discrimination according to race, gender, sexual preference, programming language, operating system or editor. You will not be judged on your experience, your abilities as a programmer or the number of followers on GitHub. The only tacit requirement will be a passion for our shared open-source monitoring toolset and the tenacity to dig in, have fun and help advance the state of our craft over the course of this two-day event.
Many of you will write code. Some of you will work on documentation. Others will speak or present workshops to inspire the other participants and help bring focus to our mission.
Everyone who registers should do so with the understanding that they are expected to participate. Attendees are for other, lesser, conferences. Monitorama is all about getting shit done and having fun doing it. Do not let this scare you. We will all walk away from Boston knowing that there is great work yet to be done, but with the collective wisdom and progress gained from an intense program of collaboration and learning.
There are only 200 seats available for Monitorama 2013. I hope to see your name on the ledger, one week from today.
- Comments (0)
Stray Bits from my DevOpsDays Roma Talk
2012-10-08 09:15:01 by jdixon
A few stray bits of information following my presentation at DevOpsDays Roma.
The talk has received a ton of positive feedback from everyone. The slides in particular have been getting a ton of redistribution on Twitter. I'm not sure if this is a sign that my deck is that much better than the actual talk, but whatever. I'm glad that people are finding it useful and/or informative.
- Comments (1)
Trip to Italy
2012-10-06 13:21:15 by jdixon
I've just concluded a week in Italy as part of my visit to speak at DevOpsDays Roma. Most people don't know this, but I was an Architecture student at Georgia Tech many years ago. As such, I was exposed to a lot of Greek and Roman history. This made a lasting impression on me; I've always dreamed of visiting Rome and it was a stroke of luck when I heard about the conference and was eventually accepted to speak.
- Comments (0)
Surge 2012 Postmortem
2012-09-28 18:35:11 by jdixon
The curtain has lowered on another couple days of scalability lessons and "disaster porn" at this year's Surge conference. Despite my initial misgivings that the registration fees were too high, the conference organizers have once again put together an experience that is quite possibly the best among all technically-oriented events.
- Comments (0)
#monitoringsucks BoF at Surge 2012
2012-09-27 14:13:16 by jdixon
Kicking off this year's Surge conference was a pair of BoF sessions. The #monitoringsucks one was packed, to the extent that a number of us had to steal chairs from the Chef BoF across the hall. I remembered to write down some of the highlights from the session. Note that I'm not quoting anyone directly and am summarizing each speaker to the best of my recollection. If you were at the event and remember things differently, please notify me in the comments section below.
- Comments (0)
Screencast - Installing Graphite from Source
2012-08-28 12:51:54 by jdixon
A couple weeks ago I uploaded a new screencast and tweeted about it, but I completely forgot to mention it here. This is a fairly thorough demonstration for installing Graphite from git checkouts on an Ubuntu 10.04 server. Please let me know if you have any questions about the content or ideas for future screencasts.
I would recommend watching it in fullscreen in at least 720p resolution. All commands and configurations referenced in the video can be found here.
- Comments (2)
Trending your PagerDuty Alerts in Graphite
2012-08-28 12:04:09 by jdixon
We've noticed an increase in alerts recently at $DAYJOB. So naturally we thought it would be helpful to begin tracking Nagios alerts in Graphite. Alas, this will only help us going forward, so I wondered how difficult it would be to retrieve historic data from PagerDuty and import it into Graphite. Turns out it isn't too hard, although we have to work around some of the limitations in PagerDuty's Incidents API.
- Comments (0)
My Personal Roadmap
2012-08-26 18:21:47 by jdixon
I've been a little busy lately and haven't found the time to post any new articles, Graphite-related or otherwise. For those who missed the announcement, I started working at GitHub in July. Initially I continued my work on Descartes; more recently my time has been split up among a few different projects, both inside and outside of work. Although I generally detest announcing plans before shipping them, I thought others might like to read about what I'm working on these days.
- Comments (0)
Trending your GitHub Commits in Graphite
2012-07-22 22:45:55 by jdixon
Today I was browsing the list of service hooks that GitHub provides. I almost forgot that there's a simple WebHook service that POSTs commit information during the git post-receive hook to any external URL. This got me thinking that it would be nice to trend commit activity inside my Graphite server. Don't get me wrong... GitHub already provides some really nice visualization for project and committer activity on their site. However, as a data junkie, I'd love to be able to correlate this activity with my own application metrics.
This was a perfect fit for Backstop, the HTTP/JSON-to-Graphite bridge. After a couple hours of futzing around I had a working version. If you haven't used Backstop before, rest assured that getting started is pretty darn easy. In fact, if you're a Heroku customer, it's easy and free. There are just a few commands to get your own Backstop server running on Heroku.
- Comments (0)
Introducing Descartes
2012-07-10 17:51:45 by jdixon
Graphite is renowned for its usefulness and ease for prototyping new charts. It's also known for having a dashboard component that leaves much to be desired. In response the community has seen a rising tide of new dashboard projects aimed at filling this gap. The growing list of third-party Graphite dashboard projects is extensive, but continues to fall short in areas such as self-service, configuration, and collaboration.
Most of this software require users to generate dashboards from JSON or other command-line gymnastics. While this is reasonable for many operations folk, it's an impedance for the engineers and business-oriented users; the same users that we want using this software for making sound decisions. Graph views are static and inflexible for collaboration and historical dialogues. In response to these shortcomings I've started the Descartes project.
- Comments (3)
Collection of D3 Tutorials
2012-07-09 13:24:05 by jdixon
A friend of mine recently asked for some good D3 tutorials and sites. At second glance these are an awesome collection of examples for using D3 and general visualization work.
Pro: You don't have to scour the web for these yourself.
Con: It's unlikely you'll ever fully consume all the awesome.
- Comments (2)
The State of Employment
2012-07-08 17:39:48 by jdixon

Seems that it's common for folks to blog about changes in employment. I hate to be left out on the fun, so I'll take a brief moment to officially announce my pending "new-hire" status with GitHub, effective tomorrow.
Friends who've already heard the news pepper their congratulations with a sense of confusion as to why I'd leave a good thing at Heroku. Indeed, I think most people in our industry would rank Heroku and GitHub at the top of their list of prospective employers. Unsurprisingly, I loved my job. I've never worked with a team of engineers as highly skilled or dedicated to their mission as the men and women at Heroku. So why would I leave?
- Comments (2)
El Cheapo Network Graph
2012-07-08 12:45:58 by jdixon
Here's an embarrassingly simple script I threw together this morning to track network latency to a handful of remote websites/networks from my home internet. Yes, I understand that these numbers are highly influenced by my proximity to various CDN networks and bear no resemblance to how actual web browsing would perform concurrently. That isn't the point. This is merely to demonstrate a cheap and easy way to get more metrics into Graphite; and at the same time, providing me with some useful reference for when my home internet provider will inevitably have hiccups.
- Comments (1)
Graph Porn and Sharing
2012-07-01 13:43:14 by jdixon
Part of what I see myself doing (by writing blog posts, creating software like Tasseo, etc) is to try and help others learn better ways of communicating our operational knowledge through visualization tools and methodologies. While I've gotten a lot of positive feedback from my Graphite articles, what I haven't seen as much is a two-way sharing of the harvested data made possible through these experiences.
I think there are a couple possible reasons for this: first, we work with "propietary" data that our employers might not want divulged; second, we assume our data is immaterial and not worth sharing. For the former, I think this is a very similar argument that many of us had with employers during the push to open source software. There is much to be gained by sharing our raw data (perhaps without all of the proprietary metadata and labels that make it relevant to our business) and seeing those examples improved upon and returned by our peers.
- Comments (0)
Velocity 2012 Postmortem
2012-06-29 16:23:23 by jdixon
This week I traveled out west for my first Velocity conference as an attendee. I went out two years ago but I was so busy juggling exhibitor duties that I didn't get to enjoy any hallway networking or formal session. This year I went in with plans to catch as many sessions as possible, particularly those skewed towards monitoring, trending and operations workflow. As expected, I skipped quite a few talks but made up for it with a lot of quality time catching up with peers and reviewing new technologies (and philosophies) in the DevOps space.
- Comments (2)
Why Big Monitoring Software Sucks
2012-06-20 17:21:47 by jdixon
There are a ton of open-source and commercial monitoring tools available, so why do we claim that monitoring sucks? Certainly there are some usable tools out there; without them our systems would be even more unpredictable and unreliable than they already are. So what makes one tool sticky where others get tried and tossed aside?
Systems Administrators (and Engineers) are a finicky bunch. We prefer to build complex systems from small, sharp instruments rather than fight with larger, malleable (read: monolithic) software. There's a reason why Pingdom and Pager Duty are enormously popular among technically agile businesses. Cost is only a small part of the equation; these customers understand (implicitly, if not explicitly) that combining these small, sharp tools into a series of logically connected functions (fault detection, notifications and historical trending) is much easier than breaking apart an Enterprise-Ready monitoring suite and coercing it to meet their unique needs.
- Comments (13)
Watching the Carbon Feed
2012-06-01 11:40:25 by jdixon
This is one of my most favorite, and certainly most underappreciated graphs. Its simplicity belies its usefulness. This single chart gives me a holistic view of our metrics feed, writes to Whisper files, as well as general system health. At a glance I can correlate slow updates caused by a spike in Whisper file creations or a backup resulting in a higher PPU value. We use some of its targets with Nagios to monitor for metric feed issues. And it's always the first place I look whenever there's a whiff of Graphite problems.
- Comments (5)
Polling Graphite with Nagios
2012-05-31 20:37:00 by jdixon
I'm a big proponent of using Graphite as the source of truth for monitoring systems where polling host and service checks have traditionally been the norm. Realistically, this will take a long and gradual shift in philosophy by the larger IT community. Until then, we can still use Nagios and Graphite in tandem for powering more insightful checks of our application metrics.
There are actually a few different "check_graphte" scripts out there. The first one I saw announced publicly was Pierre-Yves Ritschard's check-graphite project. Shortly afterwards I published my own check_graphite script. Pierre's version is smaller but doesn't appear to automatically invert the thresholds (e.g. if critical is lower than warning). Otherwise you should be fine using either module; the remaining differences are mostly isolated to implementation details and default values. Since this is my blog, I'm going to use my script for this example. ;-)
- Comments (6)
A Foolishly Sensible Proposal for Graphite
2012-05-30 22:33:26 by jdixon
Let me get one thing out of the way, I fucking love Graphite. No other piece of software I've used has returned as much getting shit done value for so little personal investment. It's a triumph of function and utility, designed to help users collect metrics, store metrics, and extrapolate from those metrics with as little pain as humanly possible. The criticisms and suggestions I present below are conveyed with the utmost respect for all of Graphite's current and past developers, and in particular, Chris Davis and the original team at Orbitz who built and released it as open source. None of the rest of this post should detract from how rewarding it is to work with this tool.
- Comments (9)
Taxes are Orthogonal to Wages
2012-05-17 08:16:24 by jdixon
I've been reading about taxing the rich and high unemployment and how the middle class is dying for as long as I can remember. What no one seems to be talking about is that these problems are orthogonal, not causal. Raising the taxes on billionaires is not going to buoy the middle class' ability to buy a new car. And neither will lowering taxes on the rich have the adverse affect. We're no more likely to see a trickle down effect from the government raising taxes as we are from lowering them.
What we really should be asking is what can we do to motivate business owners to increase employee wages without regulation? I'm not sure there is a good answer for that. I think this is a systemic problem within our upper class, one tied to a sense of privilege and a lack of personal responsibility to community.
I don't have any answers. I just wanted to get these thoughts down and see what others think.
- Comments (3)
Organizing Your Graphite Metrics
2012-05-09 22:13:10 by jdixon
One of the most common questions I get from Graphite users is how best to name and/or organize metric paths. I don't have an exhaustive list of "best practices" but I'd like to share some basic insights I've accumulated.
Misaligned paths are ok. I used to be tempted to try and keep different paths aligned in order to ease correlation of related targets within a graph. Fortunately there are plenty of helpful aliasing functions (and wildcards) to help tame unruly paths.

- Comments (3)
The Story Behind Tasseo
2012-05-07 10:19:32 by jdixon
A little over a week ago I released the Tasseo dashboard. The response I got back was nothing short of astonishing. Tasseo is a Graphite dashboard, one of many to have been released in recent months. That fact alone led me to believe it would fly quietly under the radar. I couldn't have been more wrong; Tasseo (pronounced like Casio) tallied over 200 GitHub watchers in the first weekend, and should pass 300 today.
Tasseo was originally developed as a from-the-ground-up reimplementation of the Pulse dashboard we use at Heroku. Pulse has been a tremendously valuable tool for us; unfortunately, it has some drawbacks that make it a challenge to maintain.
- Comments (9)
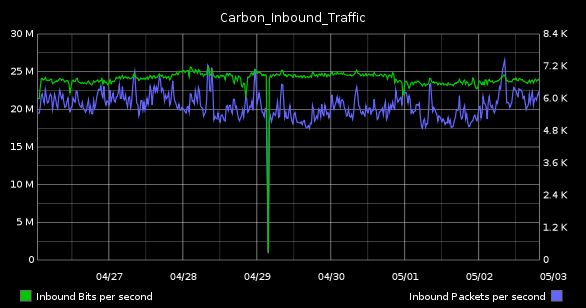
A Precautionary Tale for Graphite Users
2012-05-02 22:09:36 by jdixon
This morning I was collecting some graphs for one of our weekly status meetings. Asked to find something that represented the state of our Graphite system, I naturally gravitated to my usual standbys, "Carbon_Performance" (top) and "Carbon_Inbound_Bandwidth" (bottom).
| 1-day | 1-week |
|---|---|

|

|

|
|
The SysAdmin in me loves these because they highlight resource utilization on the server. While the former details disk I/O and CPU, the latter tracks inbound bandwidth in terms of bits and packets per-second. Although the network graph seems utterly boring (in as much as we've all used these in one form of another, from vendor-supplied dashboards to Cacti installations), it's this one that is actually the more complicated of the two to configure.
- Comments (6)
Unhelpful Graphite Tip #10 - Time Shifting
2012-04-25 08:44:44 by jdixon
Let's say you want to compare how a particular metric compares to some point in the past. This is a common practice in troubleshooting and capacity planning. What's the best way to achieve this in Graphite?
I might start off by selecting the past four weeks and visually discern the trends from week to week. Here's a graph showing the last month of AMQP activity. We can see that traffic was oscillating quite a bit over the first week and a half before smoothing out and gradually trending downward.

- Comments (10)
Unhelpful Graphite Tip #9 - xFilesFactor
2012-04-19 08:24:20 by jdixon
I love that Graphite can support per-second resolution. We've started to use it more frequently with applications that emit a constant stream of metrics to one of our aggregators. But there are times when an application might send updates less frequently, or when transient failures or network congestion result in lost metrics. In this case it makes sense to adjust your xFilesFactor value.
You may remember my last post that mentioned the whisper-info.py utility. It helps you extract metadata from your whisper files. Take for example, a whisper file for one of our collectd metrics:
$ sudo whisper-info.py /data/whisper/collectd/63694/swap/used.wsp

maxRetention: 31536000
xFilesFactor: 0.5
aggregationMethod: average
fileSize: 534580

Archive 0
retention: 86400
secondsPerPoint: 60
points: 1440
size: 17280
offset: 52

...
- Comments (9)
Unhelpful Graphite Tip #8 - Dump your Whisper Metrics
2012-04-18 10:59:38 by jdixon
If you've mucked around with your Whisper storage policies or needed to migrate your data to/from Graphite, there's a good chance you've used some of the bin scripts like whisper-info.py and whisper-fetch.py. Unfortunately there are some drawbacks with whisper-fetch.py, most notably that it only fetches content from the first archive to match the requested time period, and it won't return the original raw data after the rollup policies take effect.
- Comments (0)
Unhelpful Graphite Tip #7 - Organizing your Saved Graphs
2012-04-15 19:01:26 by jdixon
If you're logged into Graphite as an authenticated user you have the option of saving graphs, which will appear under the "My Graphs" folder in the navigation tree to the left. There are some limitations (you can't include spaces in the filename) but it's otherwise a useful feature for saving and sharing graphs with others.
Unknown to some users, Graphite's dot-delimited naming schema is not only available in metrics, but in saved graph names as well. Once you've created or modified a graph, click the Save button (floppy disk icon)...
- Comments (3)
Graphite Script for Campfire Hubot
2012-04-13 23:42:57 by jdixon
We use Campfire extensively at $DAYJOB. As our Ops team is 100% remote, it's become indispensable for us. Although it has some minor warts (lack of proper timestamps) it works quite well as a chat medium and collaboration tool. Because of its popularity, there are tons of plugins available. Not the least of which is Hubot, a bot written by GitHub specifically for Campfire.
- Comments (0)
Unhelpful Graphite Tip #6 - Filtering by Most Deviant
2012-04-13 09:57:32 by jdixon
I remember one day when I was trying to narrow down an application causing high load on an outlier within a fleet of servers. Nagios wasn't suitable for the task, as it only told me which hosts were currently spiking, not which ones have been spiking for a certain window of time. And it certainly couldn't identify a particular host based on a performance visualization.
My Graphite wizard hat went on and I went to work, narrowing down the list of suspects using wildcards and visually inspecting each host's load profile. Within 5 minutes I found my suspect and basked in my glory.
Naturally my brilliance was short-lived.
- Comments (1)
Unhelpful Graphite Tip #5 - Solid State Drives
2012-04-12 15:32:40 by jdixon
Artur Bergman (@crucially) kindly recommends:

Editor's Note: Seriously though, you really should move your Whisper files over to SSD if you haven't already. The IO gain is tremendous and allows you to spend your time being more creative with process distribution across CPU cores (hint: future article).
- Comments (3)
Unhelpful Graphite Tip #4 - Bootstrap the Django DB
2012-04-12 08:17:43 by jdixon
If you're not already aware, Graphite uses Django as the web framework for its underpinnings. In particular, it relies on Django for all user administration, authentication and authorization facilities. This is convenient for Graphite developers, but can be rather inconvenient for Graphite administrators with little-to-no Django experience.
One of my earliest headaches with automating Graphite installations was trying to workaround the interactive manage.py syncdb step from the installation doc. This is usually something everyone wants to run, since it performs the initial admin user creation.
- Comments (6)
Unhelpful Graphite Tip #3 - JSON Output
2012-04-11 10:06:13 by jdixon
I love JSON. No really, I fucking love JSON. It might have something to do with its phonetic approximation to my own name. Or it might be my preference for anything that hastens the death of XML. Either way, it's a handy format that's become ubiquitous for data interchange. And fortunately for those of us who prefer our graphs rendered client-side, Graphite supports it as an output format.
- Comments (4)
Unhelpful Graphite Tip #2 - Graph Bookmarklet
2012-04-10 18:58:26 by jdixon
I wish I could say I've been using this little gem for years. Alas, I just learned about it last night courtesy of R. Tyler Croy (@agentdero). This has already been a godsend, in less than one full day of use.
- Comments (3)
Unhelpful Graphite Tip #1 - Frequency of Events
2012-04-10 00:41:02 by jdixon
I'd like to begin sharing more of my knowledge as it pertains to using Graphite in production. Most of these upcoming posts are bound to be of the "check out this cool function" variety, but hopefully you can stitch them together into something useful. Before I proceed, I'd like to thank Chris Davis and the team at Orbitz who started this incredible software project and released it to the open-source community. Without your work I'd be stuck using something... less awesome.
Today's tip comes courtesy of a combined effort by me and Michael Leinartas (@mleinart). I've used this particular combination of functions before to calculate the number of "events" in a series during a particular timeframe. Unfortunately I failed to record this query anywhere (pro-tip: save your best Graphite functions in a document or gist, you'll be glad you did) although I had a vague idea of the functions needed. Michael was kind enough to remind me of the particular order for chaining the functions.
- Comments (6)
On Being a Product
2012-03-21 11:18:35 by jdixon
By now you've heard the adage "You're not Facebook's customer, you're the product". This is a readily accepted dirty secret of social media. In fact, the practice of selling user data for advertising precedes the origins of the Internet itself. And yet, how many of us never give a second thought to granting third-party access to our private social data via OAuth logins on Facebook, Twitter and Google?
I've complained incessantly about abuses of these authentication services. On one hand you have rudimentary, coarse-grained access levels from the authentication providers. On the other you have lazy (or ill-informed) developers configuring their application to demand more rights than it actually needs to fulfill its service contract with the user. Fortunately the OAuth dialogs are mostly transparent about the privileges you're granting the application provider. Yet many users disregard this notice in exchange for the instant gratification of a popular new social media-powered toy.
Let's assume for a moment that the third-party app you just granted access to your private data is trustworthy. What happens in six months when that app continues to skyrocket in popularity and gets bought out by Evil Data Acquisition Conglomerate, Inc.? Your data just became their data. Which also happens to be sold out to advertisers and information brokers; or to anyone who wants to scrutinize your personal behavior, contacts, buying patterns, friends and family, education, political connections or employment history.
Think about this the next time you're signing up for a new photo-sharing app with sepia filters.
- Comments (0)
Cron As A Service
2012-02-11 10:35:19 by jdixon
I recently found myself in the need for a way to run a one-off Ruby script at scheduled intervals. As this is a work project I didn't just want to run it on my laptop or some random server. Turns out there's an easy way to run this for free on the Heroku Cedar platform without having to piggyback it on a "real" application. Because there are no web processes running, we'll be able to limit our dyno usage to a single dyno (in other words, it's free).
The script itself handles garbage collection duties for removing expired hosts off our beta account with Boundary. Basically I just want it to run every hour and cull anything that hasn't reported to their collectors in a day. For the purpose of this article the contents of the script are inconsequential, although I intend to present it fully in a future post.
- Comments (0)
Trying to Get Shit Done
2012-02-09 23:38:00 by jdixon
This evening I asked for your suggestions on blocking online distractions, allowing me to focus on code for an extended period of time. I have a constant struggle with interruptions (read: shiny things) including online news, email and Twitter. There was a flood of responses in no time. Here are the more popular suggestions, along with my winners below.
- quit the offending apps
- block websites
- login with a different user
- work offline
- coffee
- music
- self-control (lol rite)
I suspect that all of these would have some benefit, perhaps except coffee, which has never given me much of a boost anyways. As a side note, I've quit Diet Coke since my surgery and am exclusively drinking water. So it's possible that coffee might give me an insanely productive hit, but I'm not willing to tread that path yet. Here are the specific steps I took which seemed to work quite well for my particular workflow.
- quit Twitter app
- quit Chrome (primary browser)
- quit Firefox (used for HTML email, Facebook and banking)
- quit Propane (Campfire app, work communications)
- quit Adium
- quit Skype
- detached my remote screen session (mutt and irssi)
- equipped Sony MDR-V6 headphones
- launched Spotify radio (trance)
- put iTerm2 in full-screen mode (used for psql, git and debugging development server)
- put MacVim in full-screen mode
- launched Safari for API docs and development site
I'm pleased with the recent experiment, even if it only lasted one hour. I'll continue to make adjustments and report any significant improvements I find.
- Comments (2)
Sandwich Porn
2012-01-15 23:57:59 by jdixon
Can you get any simpler than this and still call it a sandwich? Belying its simplicity, this rustic combination has excellent texture and flavor. Lay them out on a baguette and call it a day.

- Comments (0)

 RSS 1.0